
The answer to this question is yes.
On January 27th 2016 an article appeared in the Pittsburgh Tribune entitled “Pittsburgh Water & Sewer Authority flooded with test requests amid lead concerns” [1]. The article quoted lead levels in PWSA as being 14.7 parts per billion, three-tenths shy of the legal limit of 15 parts per billion (ppb). Other sources have also mentioned Pittsburgh. The article also went on to say that “the authority switched from caustic soda (sodium hydroxide) to soda ash (sodium carbonate) in order to better control its pH and potential corrosiveness”
When I first read the article the decision to change from sodium hydroxide to sodium carbonate seemed odd as this would increase the concentration of carbonate, which I knew would also increase the concentration of lead. So I decided to run some calculations using pH and alkalinity data that I had obtained from an online repository for water companies. The data covered 12 months of 2015. There was no data for phosphate and I couldn’t tell whether it was absent because it was not reported or because the phosphate chemical was not added. Without this information I couldn’t proceed.
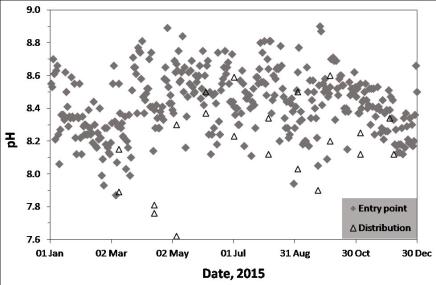
This week I heard from PWSA that phosphate is not added to the tap water. So I was able to proceed with my calculations. The concentration of dissolved lead is strongly dependant on pH and alkalinity so it’s important to look at how these parameters changed in 2015. You can see that the pH varies greatly between pH 8.0 and pH 8.8. The median value is about pH 8.4.

The alkalinity also varies between 30 and 70 mg/L as CaCO3. There isn’t much scatter but there are some peaks one at the end of February and at the end of October. The two graphs show that the tap water is slightly alkali with low to medium alkalinity (soft to moderate hardness).
The entry point data refers to samples at the water treatment works and the distribution data refers to samples taken from a sampling point in the city. You can see that the distribution pH is generally lower than the entry point pH. This reduction is typical for soft waters which tend to absorb carbon dioxide when they leave the treatment works (carbon dioxide is a weak acid in water).
In order to determine the concentration of dissolved lead I used a programme called PHREEQC, which is available free from the U.S. Geological Survey. I ran a number of scenarios in which the pH varied from 7.8 to 8.8 and the alkalinity varied from 30 to 70 mg/L. I also added some concentration values for calcium, magnesium and chloride, which I had Taken from a study on the Allegheny River water. I couldn’t find data from the water treatment works but the river water data is a good start (Ca = 25mg/L, Mg = 5mg/L and Chloride = 10 mg/L). The table and graph below shows the results.
| Alkalinity = 30 mg/L | Alkalinity = 70 mg/L | |
|
pH |
Predicted lead, ppb |
Predicted lead, ppb |
|
7.8 |
43 | 44 |
|
8.0 |
35 |
37 |
| 8.4 | 25 |
27 |
| 8.8 | 19 |
22 |

There are three main points to make. Firstly, the predicted lead levels were all above the legal limit of 15 ppb. Secondly, that changing the alkalinity from 30 to 70 mg/L does not significantly alter the concentration of lead and thirdly, that the concentration of dissolved lead is strongly pH dependent.
It is now possible to see why PWSA is concerned about pH, particularly the degree of variation, which on some days sees the water at pH 8.0 and on other days pH 8.8. If they were to take a water sample on a day when the water is at pH 8.0 then they would expect to see higher concentrations of lead and more compliance failures. The switch from sodium hydroxide to sodium carbonate was presumably undertaken to improve the pH control. The addition of carbonate (a type of carbon dioxide) at the water treatment works prevents more carbon dioxide from being absorbed as the water is transported to the city and therefore militates against a pH reduction. It also helps to control the pH by acting as what is called a buffer. If the switch has worked then current pH values should be between pH 8.6 and 8.8. It would be interesting to know whether this is the case.
Even with better pH control this still leaves the concentration of lead above the 15 ppb limit. The answer to this problem is to add phosphate. Not adding phosphate and having a high chloride concentration were two of the mian problems at Flint. Pittsburgh doesn’t have a high chloride concentration but it would benefit greatly from adding phosphate. The following table and graph show the impact of adding phosphate at 1 mg/L as P to PWSA tap water.
| Alkalinity = 30 mg/L |
Alkalinity = 70 mg/L |
|
|
pH |
Predicted lead, ppb |
Predicted lead, ppb |
|
7.0 |
9 | 13 |
|
7.4 |
6 | 10 |
|
7.8 |
5 | 9 |
| 8.0 | 5 |
10 |
| 8.4 | 6 |
11 |
| 8.8 | 8 |
15 |

The results show that a significant improvement in dissolved lead concentration could be obtained by adding 1 mg/L as P to PWSA tap water. The concentration of lead does not exceed 15 ppb between pH 7.0 and pH 8.8. The best results would be obtained by using a pH of 7.8 to 8.0 and an alkalinity of 30 mg/L would give better results than an alkalinity of 70 mg/L.
So if I were PWSA I would start adding phosphate to the tap water and after a period of time I would start to reduce the pH of the tap water to between 7.8 and 8.0.
PWSA does have a lead problem but its one that can be overcome by adding phosphate.
————————————————————-
The calculations shown here are for predicted lead. This is the concentration expected after the tap water has been stagnent in the pipe for some time. So it represents a maximum amount. A water company will take a 1 litre sample. Part of this sample will come from water sitting in copper pipes within the house and the other part will come from water sitting in the lead pipe between the house and the water mains pipe in the street. Therefore, the maximum lead concentration may not be seen in the first 1 litre sample. The temperature of tap water effects the concentration of dissolved lead and in winter it may be half that in the summer. A simulated temperature of 25 C was used for the calculations although a lower temperature would have been better. In summary, the predicted lead concentrations are likely to be slightly higher than the actual concentrations. Predicted lead concentrations are not field data but they do provide a useful guide to what is happening.
If I had one question for PWSA it would be “Why are you not adding phosphate?”
—————————————————————-
The downside with adding phosphate is that it can end up in rivers and lakes in a process called eutrophication. But that is another story.
